This exercise requires a Power BI Premium subscription, which can be acquired at https://powerbi.microsoft.com.
- Log in to your Power BI account ➢ select Workspaces from the navigation bar ➢ click the Create a Workspace button ➢ enter a workspace name ➢ enter a description (see Figure 5.32) ➢ and then click Save.
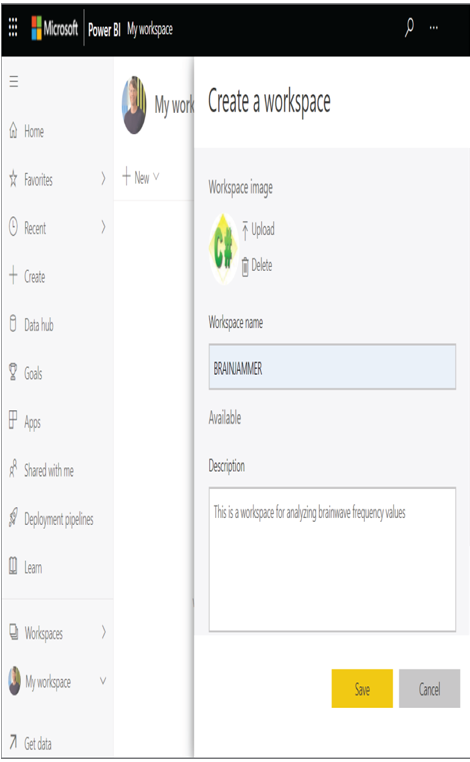
FIGURE 5.32 Performing exploratory data analysis—visualizing data in Power BI (2)
- Once the Power BI workspace is provisioned, select the + New drop‐down menu item ➢ select Upload a File ➢ and then upload the CSV file from step 7 in Exercise 5.11. The file, Analysis.csv is available on GitHub, in the Chapter05/Ch05Ex12 directory. Once the file is uploaded, you will see it in the workspace, as shown in Figure 5.33.
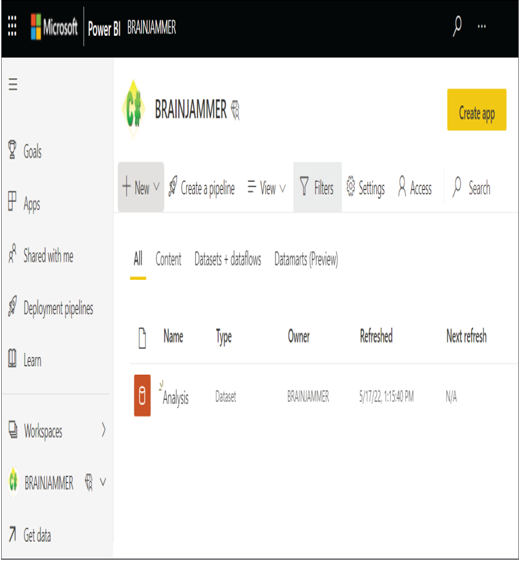
FIGURE 5.33 Performing exploratory data analysis—Power BI workspace
- Hover over the file with your mouse ➢ click the three vertical dots ➢ select Create Report from the popup menu ➢ expand Analysis in the Fields pane ➢ drag FREQUENCY into the Axis text box in the Visualizations pane ➢ drag SCENARIO into the Legend text box ➢ drag MEDIAN into the Values text box ➢ and then select the Stacked bar chart icon. The chart resembles Figure 5.34.
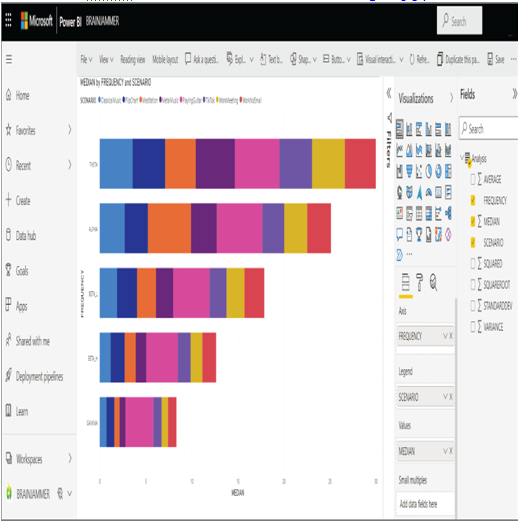
FIGURE 5.34 Performing exploratory data analysis—visualizing brain waves in Power BI
- Select the Save menu item ➢ enter a name for the report ➢ and then Save.
The hypothesis of ALPHA being high while meditating turns out to be true, as shown in Figure 5.35. The meditation scenario has the highest ALPHA median value of all scenarios. It makes sense that while meditating the subject would be in a relaxed state.
Figure 5.36 shows a low brain wave reading value for GAMMA. The result is inconclusive because GAMMA readings for all scenarios are smaller in general than the other frequencies. In this case, more analysis is required to prove the hypothesis as to whether the test subject is learning or in a creative mindset while watching TikTok.
You now have a taste of what it is like to perform EDA and how to make some conclusions from it. You can use many other tables and perspectives to approach the analysis of this data. The findings and insights you can uncover are vast.
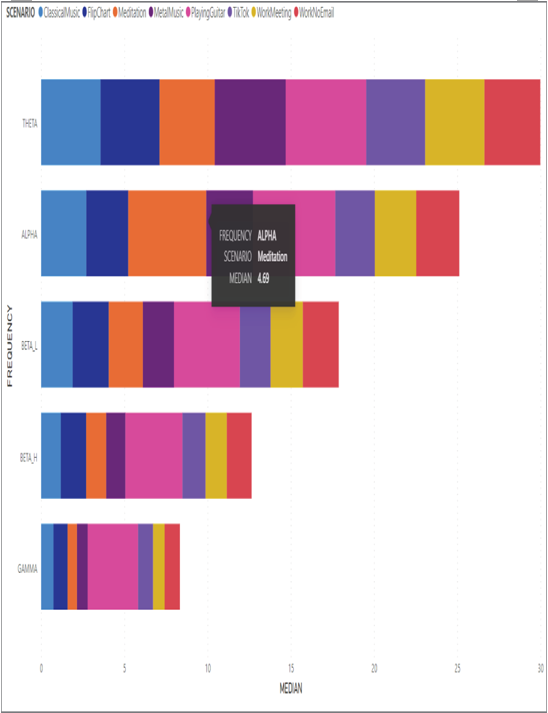
FIGURE 5.35 Performing exploratory data analysis—visualizing brain waves alpha meditation
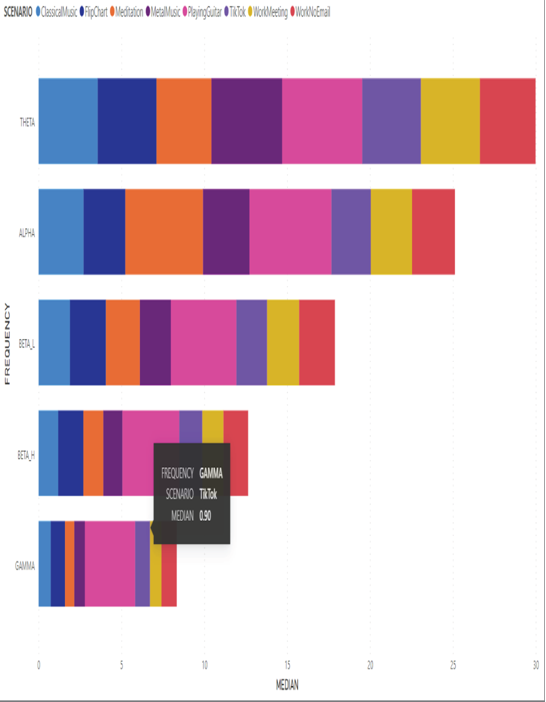
FIGURE 5.36 Performing exploratory data analysis—visualizing brain waves gamma TikTok
